


The third release of the integrated BigDataOcean platform was released featuring an improved partially functional high-fidelity version of the platform, consisting of a list of enhanced backend and frontend services that were implemented towards the aim of enhancing the offerings of the platform and the realisation of the integrated maritime data value chain of BigDataOcean. To achieve this, the feedback received from the assessment of the end users on the previous release of the platform (Release 2.00) was thoroughly analysed and the outcome of this analysis was translated into a series of necessary improvements and refinements on both the backend and the frontend services of the platform in order to ensure that the offered functionalities are addressing the stakeholders’ needs.
BigDataOcean Back-End Services
In the third version of the integrated BigDataOcean platform, a list of backend services were implemented with the aim of providing the necessary backend functionalities that will be utilised by the frontend services in order to implement the envisioned platform’s offerings that address the needs of the different stakeholder groups identified by the consortium. The list of the backend services is composed by the Data Ingestion, the Query Execution, the Service Execution and Building, the Visualisation Generation, the Dashboard Creation and Display and the Access Control Service.
The Data Ingestion is providing automated mechanism that enables the automatic retrieval, semantic enrichment and parsing of the incoming datasets is composed by four services, namely the File Handler, the Vocabulary Repository, the Harmonisation Tool and the File Parser services.
File Handler is responsible for retrieving the new raw datasets (via FTP or HTTP) in a preconfigured time range and storing them in the HDFS file system. Once a new dataset is available, the Harmonisation Tool is informed and the semantic enrichment of the new raw dataset is started. The Harmonisation Tool utilises the metadata profile for the selected data source and automatically produces the appropriate metadata, describing both the metadata and the datasets themselves, using the metadata vocabularies available in the Vocabulary Repository. Once the semantic enrichment is completed, one of multiple running instances of the File Parser, is informed and the parsing process is started. The parsed and normalised information is stored in Hive storage through Presto and it is available for query process and analysis. The whole process is orchestrated by Apache Kafka and the various steps of the process are interconnected in an asynchronous way with two Kafka topics, one containing information for the new available datasets without metadata and one containing information for the new semantically-enriched datasets that have not been parsed yet. The BigDataOcean’s automated data ingestion process is illustrated in the following figure.
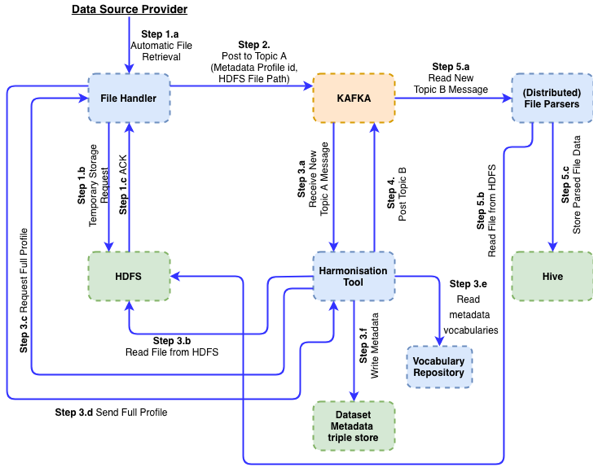
Figure 1 – BigDataOcean data ingestion
The Query Execution is enabling the exploration of the available datasets along with their variables, the formulation of both simple and complex queries and the dynamic combination of information originating from different sources.
The Service Execution and Building is enabling offers the ability of executing advanced analytical services over big and diverse datasets coming from multiple sources. The service execution utilises Apache Spark 2.2 and its Python or Scala API and several libraries such as MLib and Weka. The code of the services are written and maintained in Apache Zeppelin Notebooks and Apache Livy is utilised for remote execution of Spark jobs over a REST API.
The Visualisation Generation is enabling the generation of different visualisations that can be viewed at multiple areas within the platform, either when a user is exploring the available datasets, viewing a dashboard or executing a service. The visualisation is divided into three groups: a) Chart visualisations such as line charts, column charts, pie charts, histograms and time series charts, b) Map visualisations such as plotlines, polygons, contours on map, heatmaps and markers on map and c) Miscellaneous visualisations such as data tables and aggregate values.
The Dashboard Creation and Display enables the creation of customised dashboards/ reports that constitute of multiple components (widgets) such as visualisations, notes containing text, images and more in a custom layout defined by the user. A dashboard object is created and stored and upon receiving a display request is retrieved and displayed to the user.
The Access Control Service is providing the access control mechanism of the BigDataOcean platform. Within the context of the platform, the Attribute-Based-Access-Control model is adopted, in which access to Resources (different datasets, dashboards and services of the platform) is controlled by evaluating rules (policies) against the attributes of the Subject (users), the Actions and the environment relevant to a request.
BigDataOcean Front-End Services
In the third version of the integrated BigDataOcean platform, a list of frontend services were implemented with the aim of providing the different environments and tools of the platform that will be exploited by the different stakeholder groups. Through the frontend services, dataset exploration, query execution and creation of visualisations, dashboards and analytics in form of services are offered. The list of the frontend is composed by the Landing Page, Dataset and Metadata Exploration, the User Profile, the Query Designer, the Dashboard Builder, the Services/ Analytics Builder, the Data Upload and the Applications and Dashboards.
The Landing Page is introducing the users into the offerings of the platform upon successful login. Within this page, the user can navigate to the BDO Datasets by using the search bar in the centre of the page, use the Query Designer Tool using the “Explore and Create” link or see the available applications and dashboards by clicking on the corresponding link on the top left.
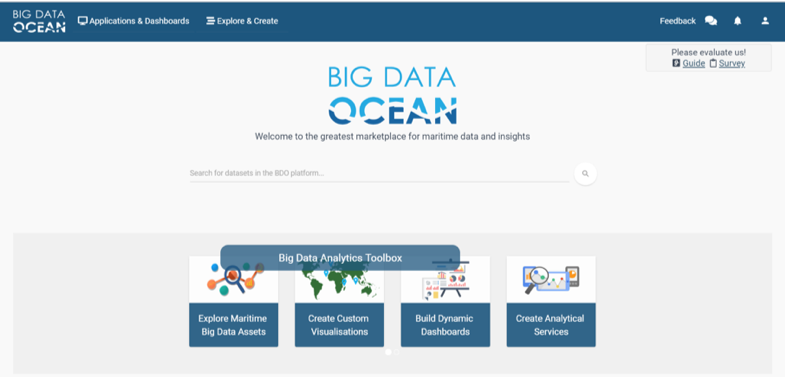
Figure 2 -BigDataOcean platform’s landing page
By using the search bar in the centre of the page, the user is navigated to the Dataset and Metadata Exploration aggregated information for every dataset is displayed along with a set of filters such as filtering by a dataset’s title, its variables, its publisher, its observation type, its privacy status and whether it contains time or depth information, in order to find the datasets of his interest. The list of results contains basic information about the datasets such as: title, a short description, source, size, category and privacy status. By clicking on of the datasets, more details regarding the chosen dataset is displayed, as well as information for the dataset and the metadata of the dataset.

Figure 3 – Platform’s dataset overview
In the User Profile page, the user is able to view and edit his profile basic information by clicking the profile icon on the right side of the top navigation bar. The user is able to provide additional information about his own profile such as the organisation the user is associated with, the user’s business role and more.
By selecting the Query Designer’s environment, the user is able to explore the available datasets of the platform and create custom queries with rich expressive capabilities, through an intuitive graphical interface, without writing any SQL. At first, the user selects the dataset to query from the list of all available datasets or uses the search filter in order to find a specific dataset, to search datasets by variable or publisher using the related dropdown lists or to filter datasets with time or depth information using the related checkboxes.
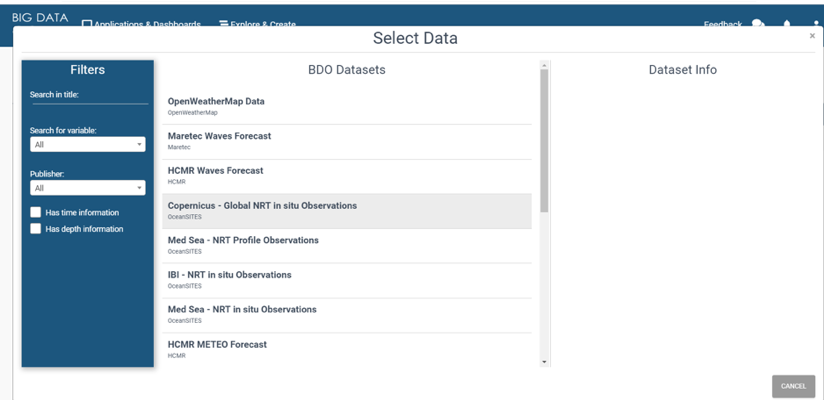
Figure 4 – Query Designer’s environment
By selecting a dataset from the list, the user can select one or more variables from the dataset to add them in the query. The query execution is triggered by clicking the “RUN” button and the raw results are listed. On the left panel the user can see the queried variables and on the right side the user can browse the data using the “NEXT” and “PREVIOUS” buttons (Figure 5). By selecting the “CHART” tab, the user is presented with the list of all the available visualisation types and upon selecting a visualisation type a form guides the user to configure the desired visualisation and finally the visualisation is generated.
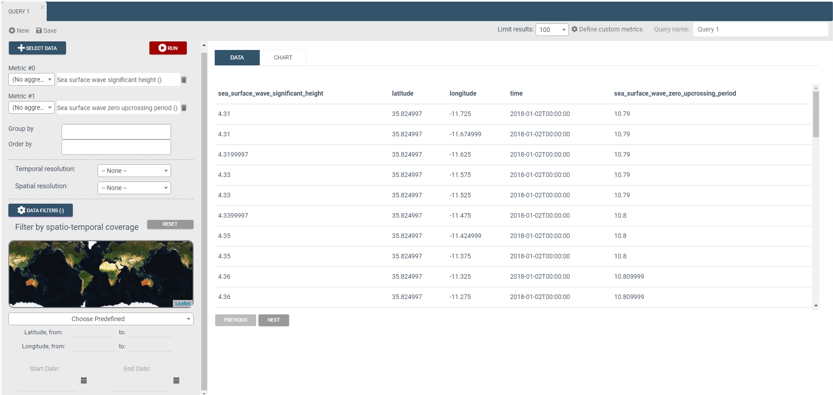
Figure 5 – Query results
Additionally, the user can select to filter the results by applying spatial and temporal filtering by the multiple options that are offered and create custom filters for the different variables and dimensions of a query.
By selecting the Dashboard Builder’s environment, the user is able to create a custom dashboard/ report by adding multiple widgets with visualisations, images, tables and text into a single place. An interface similar to the Query Designer’s environment is utilised in order to add a new visualisation on the dashboard, where the user is prompted to select the data (one of the already saved queries) that he wants to use for the visualisation, the visualisation type and provide the custom configuration. A preview of the visualisation is presented to the user along with the option to add it to the dashboard. Additionally, the user is given the option to include in the dashboard custom notes, text, images, tables and other elements using a WYSIWYG editor. Once all widgets are included in the newly created dashboard, the user is able to resize each widget separately, change the layout and the position of each widget and also provide custom titles in the widget and the whole dashboard. When the user is satisfied with the dashboard he created, he can save it by pressing the “Save Dashboard” button. The user is able to view and edit the saved dashboard at any time.
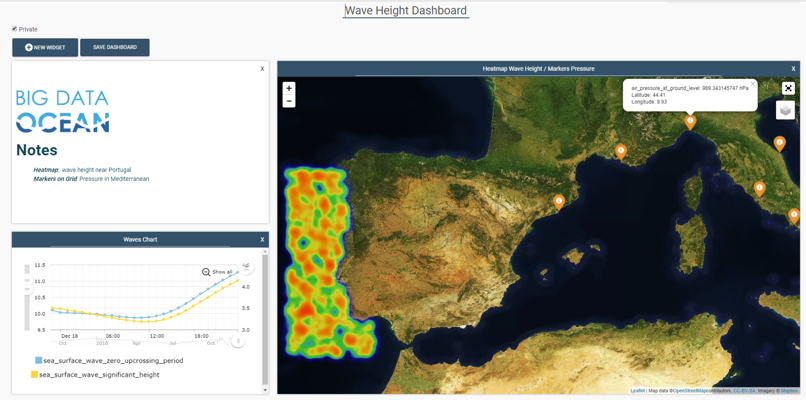
Figure 6 – A custom dashboard with multiple widgets
The following figures illustrate some examples of the available visualisation that can be created through the BigDataOcean platform and can be added to a dashboard.
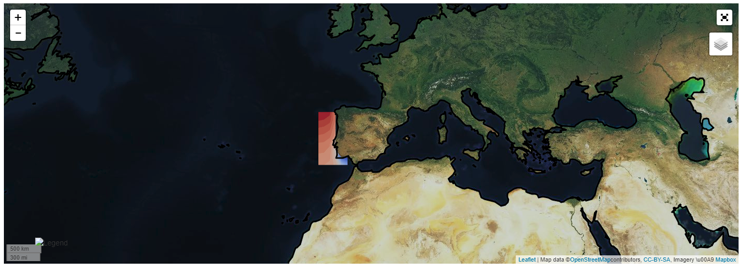
Figure 7 – Map filled contour visualisation
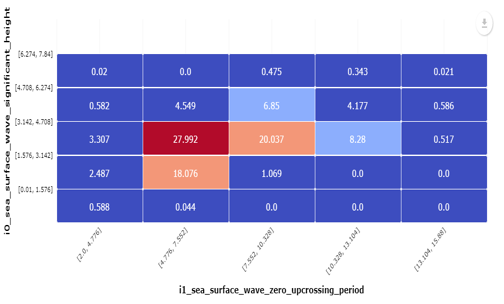
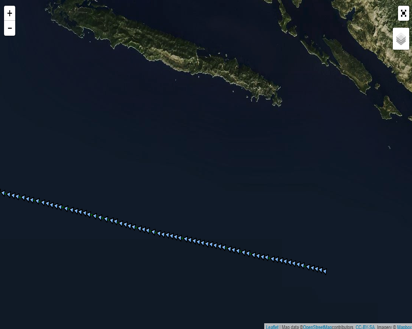 Figure 8 – 2D histogram visualisation and Points-on-map visualisation (Plotline)
The Service / Analytics Builder is offering the environment to enable the creation of a new service on top of the BigDataOcean platform. At first, the user is selecting the different queries that will be used in the context of the service from the list of already saved queries or creates new queries. In the second step, the arguments that will be exposed to the service end-user, that are either filter parameters or algorithm’s parameters, are defined. The third step is the creation of the service code utilising the Apache Zeppelin Notebook. In the final step, the output of the service is defined by writing the required code (HTML, CSS, and JavaScript) of the interface or using a predefined service template. Additionally, the service builder offers the option to add a new visualisation into the service output. Finally, the newly created service can be previewed and the user can define the terms of the service (i.e. the title, price, etc.) and then publish it.
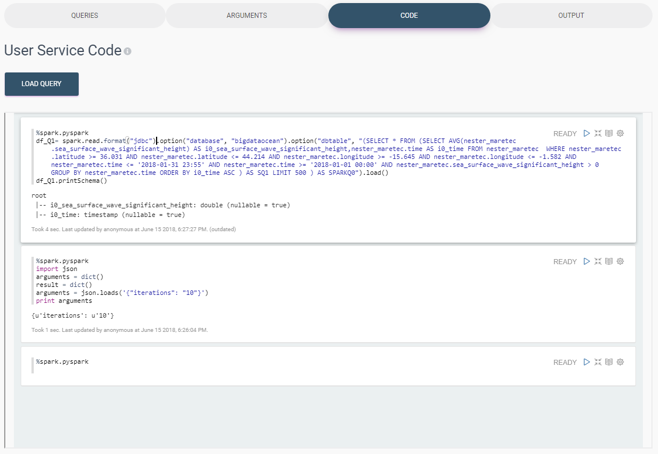
Figure 9 – Service Building – Service code using Notebook
The Data Upload service is enabling the uploading of a new dataset from a local file or downloading of a new dataset from a data source. The user is able to select a local file from his local environment in order to be uploaded in the platform or provide the connection details in order the platform to download the pointed file.
In the Applications & Dashboards page all the available services and the created dashboards of the BigDataOcean platform can be viewed. For each service and dashboard, the user can see some information and a short description, while also the user can choose to view one of them. Access to the available services and dashboards however is controlled by the Access Control service as described above. The available services and dashboards are organised in four sections, the ones that are publicly available and the ones that are private with limited access to the owners and the ones granted access by the owner.
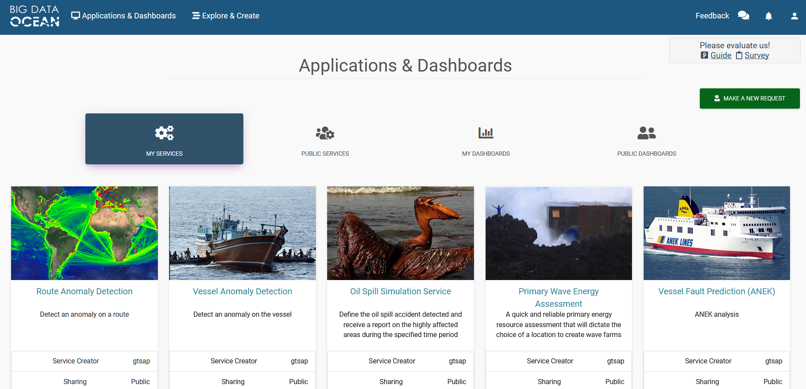
Figure 10 – Applications and Dashboards
The list of available services in the BigDataOcean platform contains the Route Anomaly Detection service, the Vessel Anomaly Detection service, the Mare Protection service, the Primary Energy Resource Assessment service, the Fuel Consumption Reduction service and the Fault Prediction and proactive maintenance service. The following figures illustrate some examples of the available services in the BigDataOcean platform.
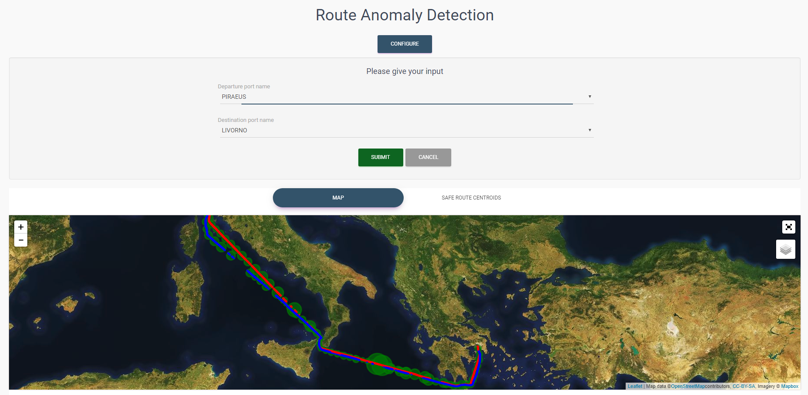
Figure 11 – Route Anomaly Detection Service
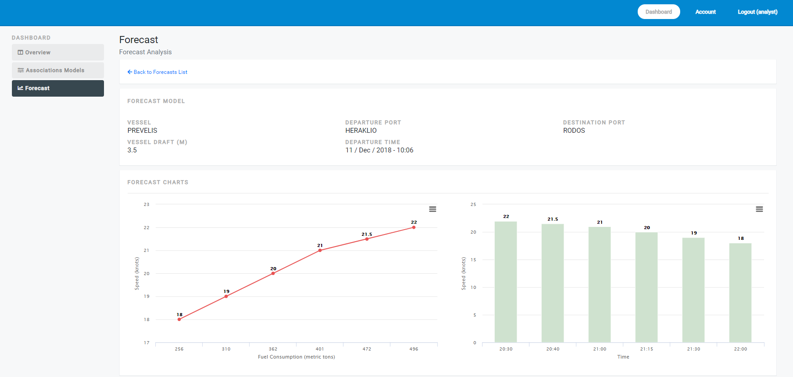
Figure 12 – Fuel Consumption reduction service